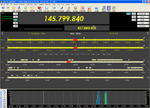
Bandscope - Scans a defined frequency range in selectable steps and displays a graph of S Meter values (vertical axis) against frequency (horizontal axis).
 The current frequency range is displayed in the horizontal axis legend across the bottom of the graph. S Meter values are shown in the vertical axis legend at each end of the graph detail. The step size and user-selectable buttons are displayed at the left.
A vertical frequency marker will move across the bandscope display as the scan progresses. Frequency and band position displays in the main program window will also update in real time.
Two colours are used in the display. Past scans are displayed in sample-and-hold fashion in the background colour - blue in this case. The current scan is superimposed over the top - green in this case.
A fresh scan adds the most recent scan to the background detail building up a total activity display over time.
A left mouse click anywhere within the bandscope window will tune the radio to the frequency of the position clicked.
It is essential to use a fast AGC characteristic when using the bandscope. If the AGC is too slow, there will be a distorted signal display. As the data is based on S Meter values, slow attack times will have a delayed response and long hang times will show a gradually diminishing signal over a far wider frequency span.
ATUs that may respond to frequency changes should also be disabled.
Control Buttons:
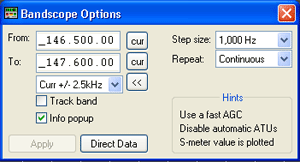
 The Options window is for manually customising the bandscope scan.
From: - Enter the upper or lower limit of the required scan. The
To: - Enter the remaining limit of the required scan. The
The
Track band - If this option is checked, a single click on a frequency band bar on the main program display will cause that band to be included in the scan.
Info popup - If this option is checked, and the mouse cursor is placed inside the bandscope window, information relative to the frequency immediately below the cursor will be displayed at the top of the window.
Step size - This drop down listbox provides a scan step size selection from 100Hz to 25,000Hz.
Repeat - This drop down listbox provides the selection of either a continuous scan or once only.
