 Analysis - This option provides an analysis of your logbook entries with the ability to create your own analysis definitions.
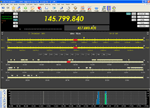
There are a number of icons available in the Analysis toolbar.
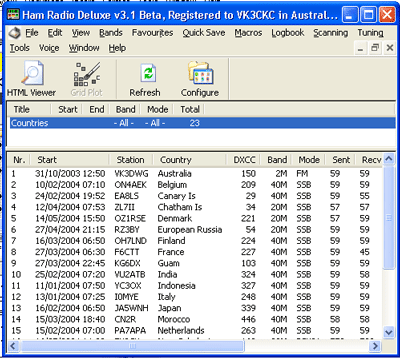
 HTML Viewer - Provides an automated HTML (Web Page lookalike) view of you logbook entries relative to the analysis definition/s (see below). The HTML file will then be displayed in your Internet browser.
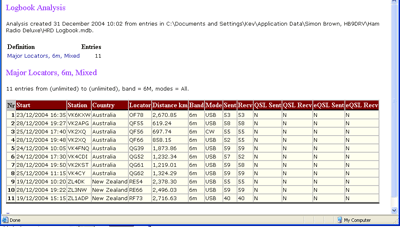 HTML Viewer - A click on the HTML Viewer icon creates a web page that will be displayed in your default browser. If you wish to, you could save the page and send to someone.
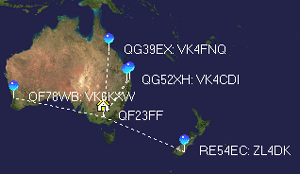 Grid Plot - If there are grid locators in the specified analysis definition, they can be sent to the Mapper program for plotting. The image here shows a few recent 6m contacts on the high resolution bluemarble world map.
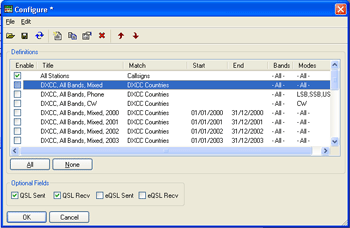 Configure - Here is where you can define your analysis conditions and select one or more to be used in your particular analysis. The window opens with a display of previously defined analysis definitions.
The usual Copy, Edit, etc., icons are provided to help with the definition. Some of the icons will not be available unless a definition is selected. The tooltips will give a general guide as to their function.
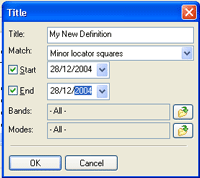 Clicking the New icon results in the Title window at left. The analysis is defined by specifying the data for a number of fields that are used for the analysis columns.
Title: - Enter a unique title for this definition.
Match: - Make a selection from the drop down listbox for matching analysis data.
Start: - If you wish to specify a Start date, check the checkbox and choose a date via the drop down arrow.
End: - If you wish to specify an End date, check the checkbox and choose a date via the drop down arrow.
Bands: - The Bands selection box will provide a Band Selection window from which to select the bands to include. If you only want a few bands, it may be easier to check None in the Band Selection window and then individually check the few bands that you require.
Modes: - The Modes selection box will provide a Mode Selection window from which to select the modes to include. If you only want a few modes, it may be easier to check None in the Mode Selection window and then individually check the few modes that you require.
Once you have defined your analysis criteria you can select or deselect any definition/s from the Configure window.